
Harris County apartment sales have plummeted in 2023 because of higher interest rates, higher casualty insurance, higher property taxes and other operating expenses and a massive chasm between the expectations of buyers and sellers.
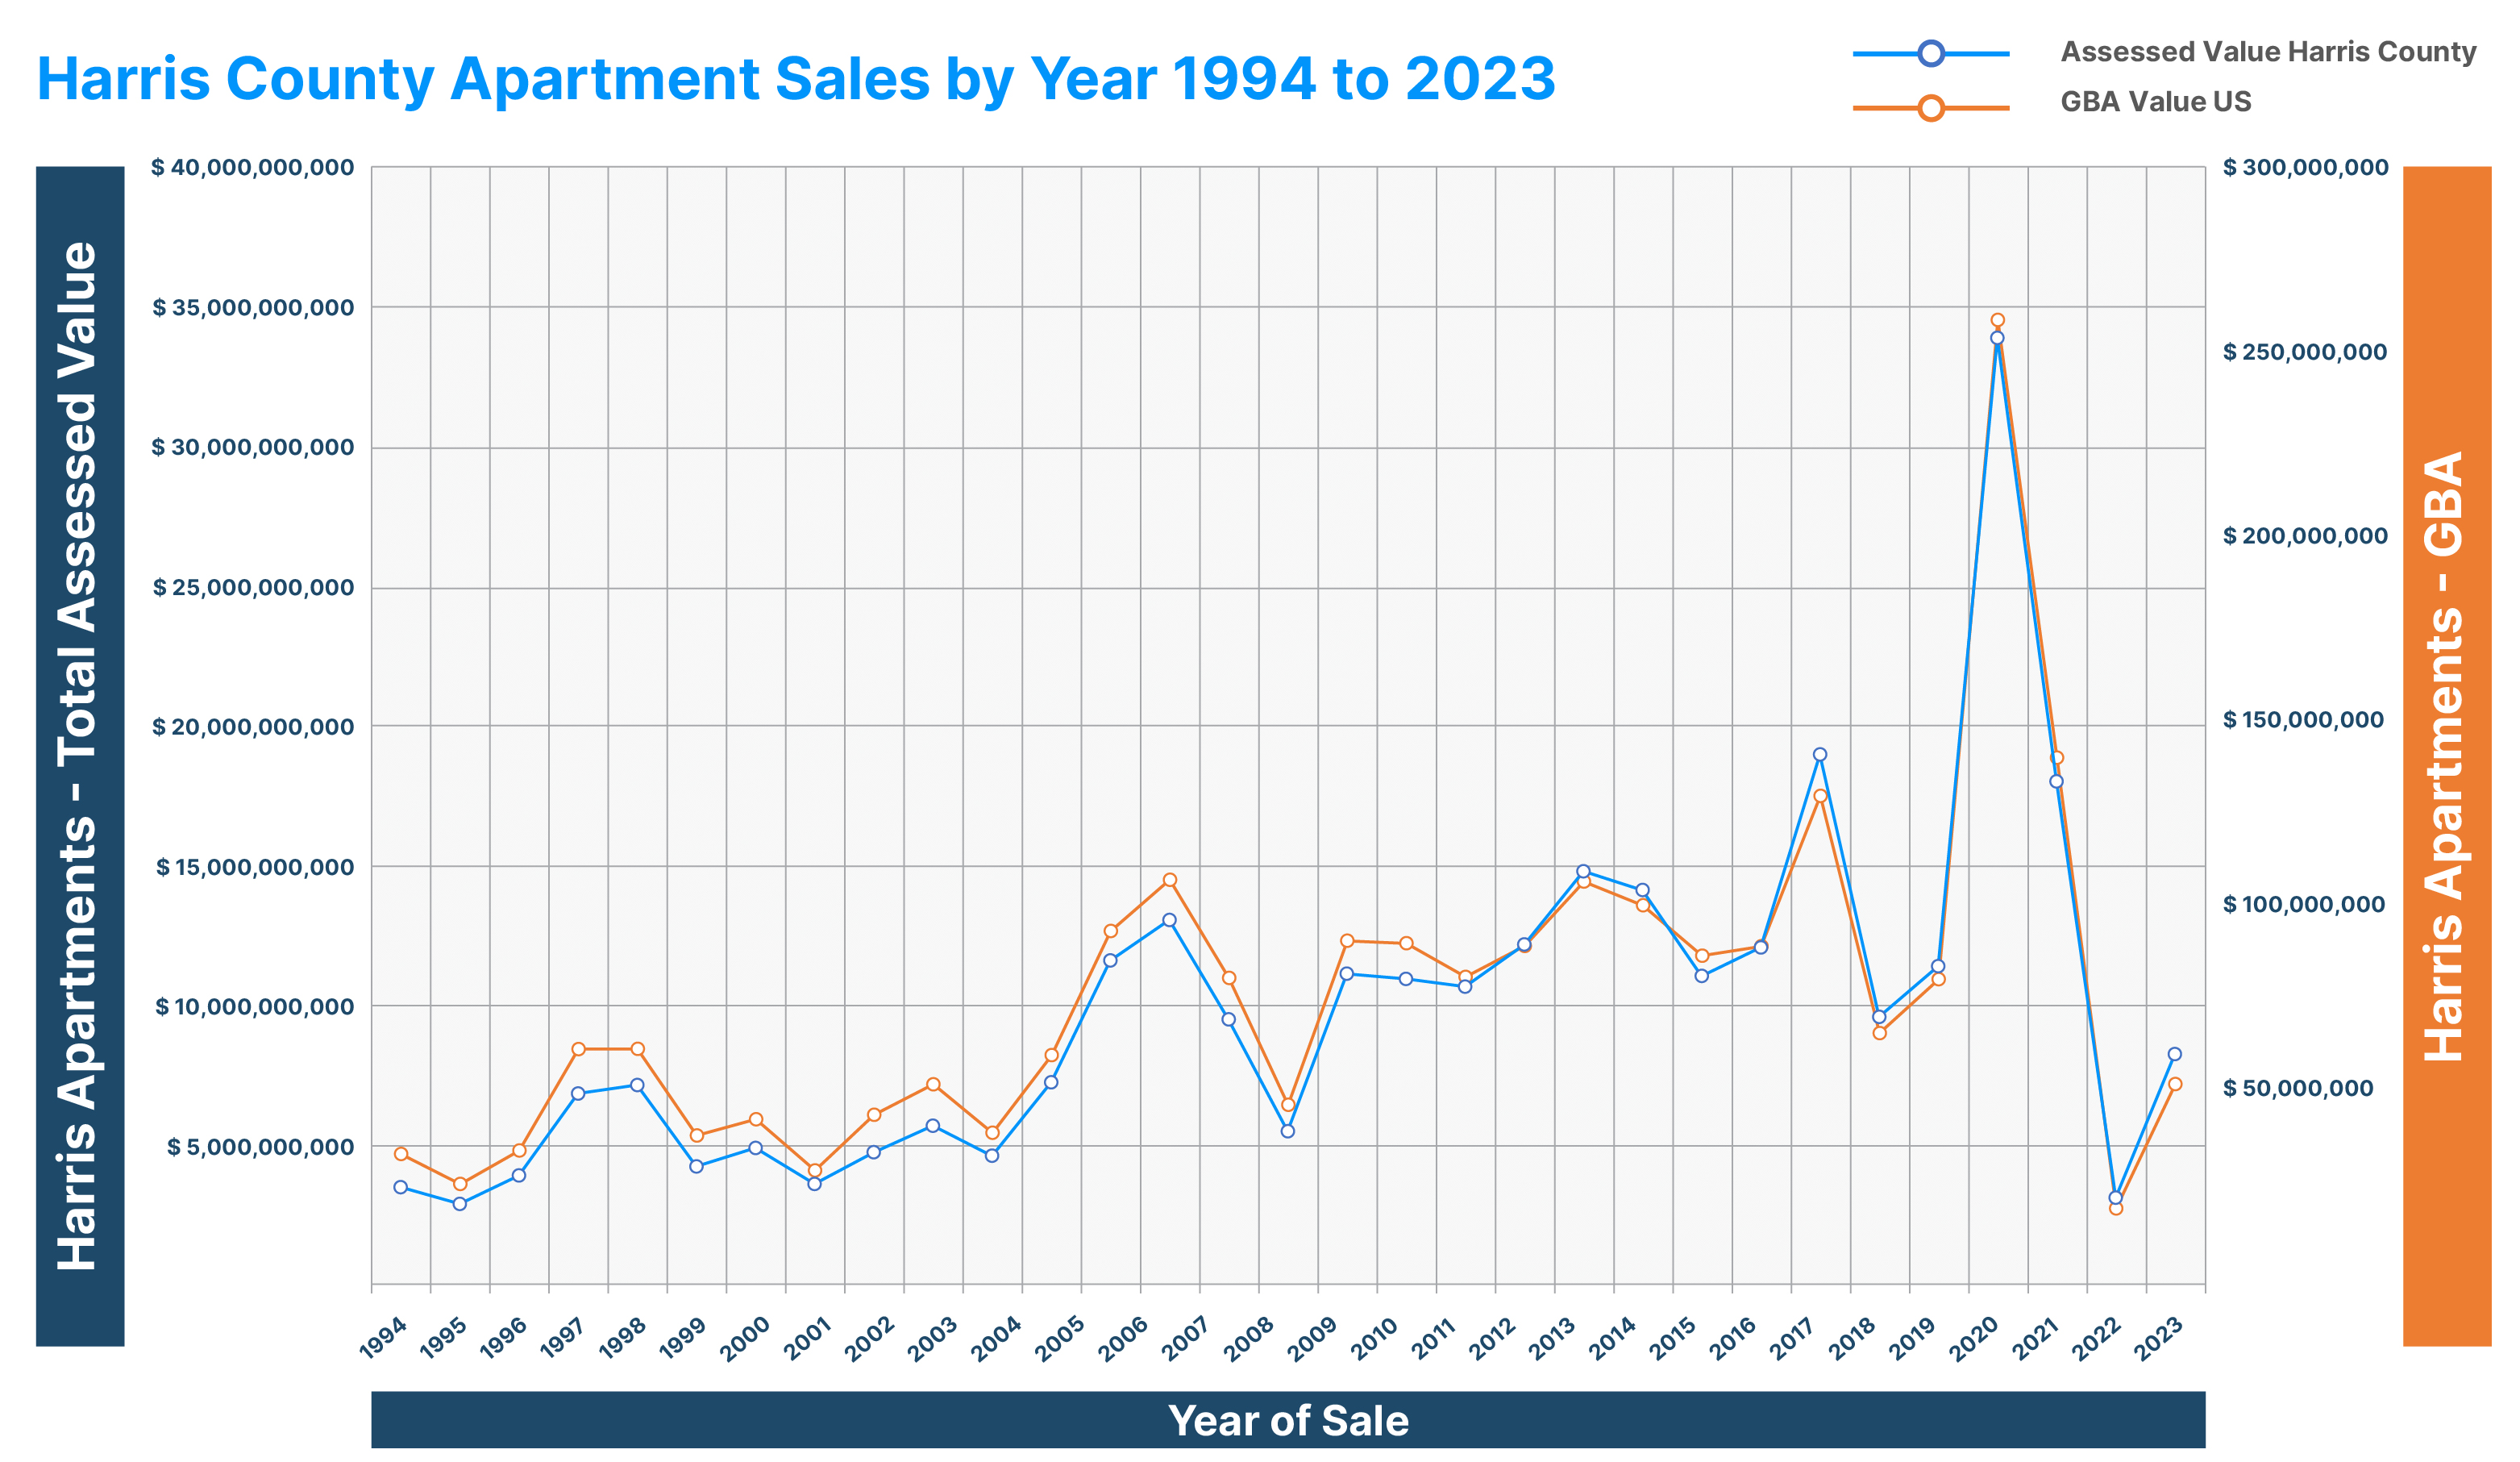
Harris County and national apartment sales peaked in 2021 with a robust enthusiasm for apartments due to an extended trend of rising values and rents. Steadily rising values were driven in part by a long-term downward trend in interest rates, which abruptly reversed in early 2022.
Harris County apartment sales are on pace to reach $7.7 billion in 2023 versus $33 billion in 2021.
Nationally, the volume of apartment sales is off by 66 to 75% when considering the number of sales, the assessed value of sales and the gross building area (GBA) of apartment sales. Year-to-date Harris County apartment sales are off 82 to 84% based on the assessed value of apartment sales and the gross building area of apartment sales in 2023 versus 2021. Year-to-date annualized apartment sales are based on 5 months of sales annualized. 2023 Harris County apartment sales have fallen to the level set in 2009 after the housing crisis of 2007 to 2008. Let’s review the factors impacting apartment sales, both in Houston and nationally.
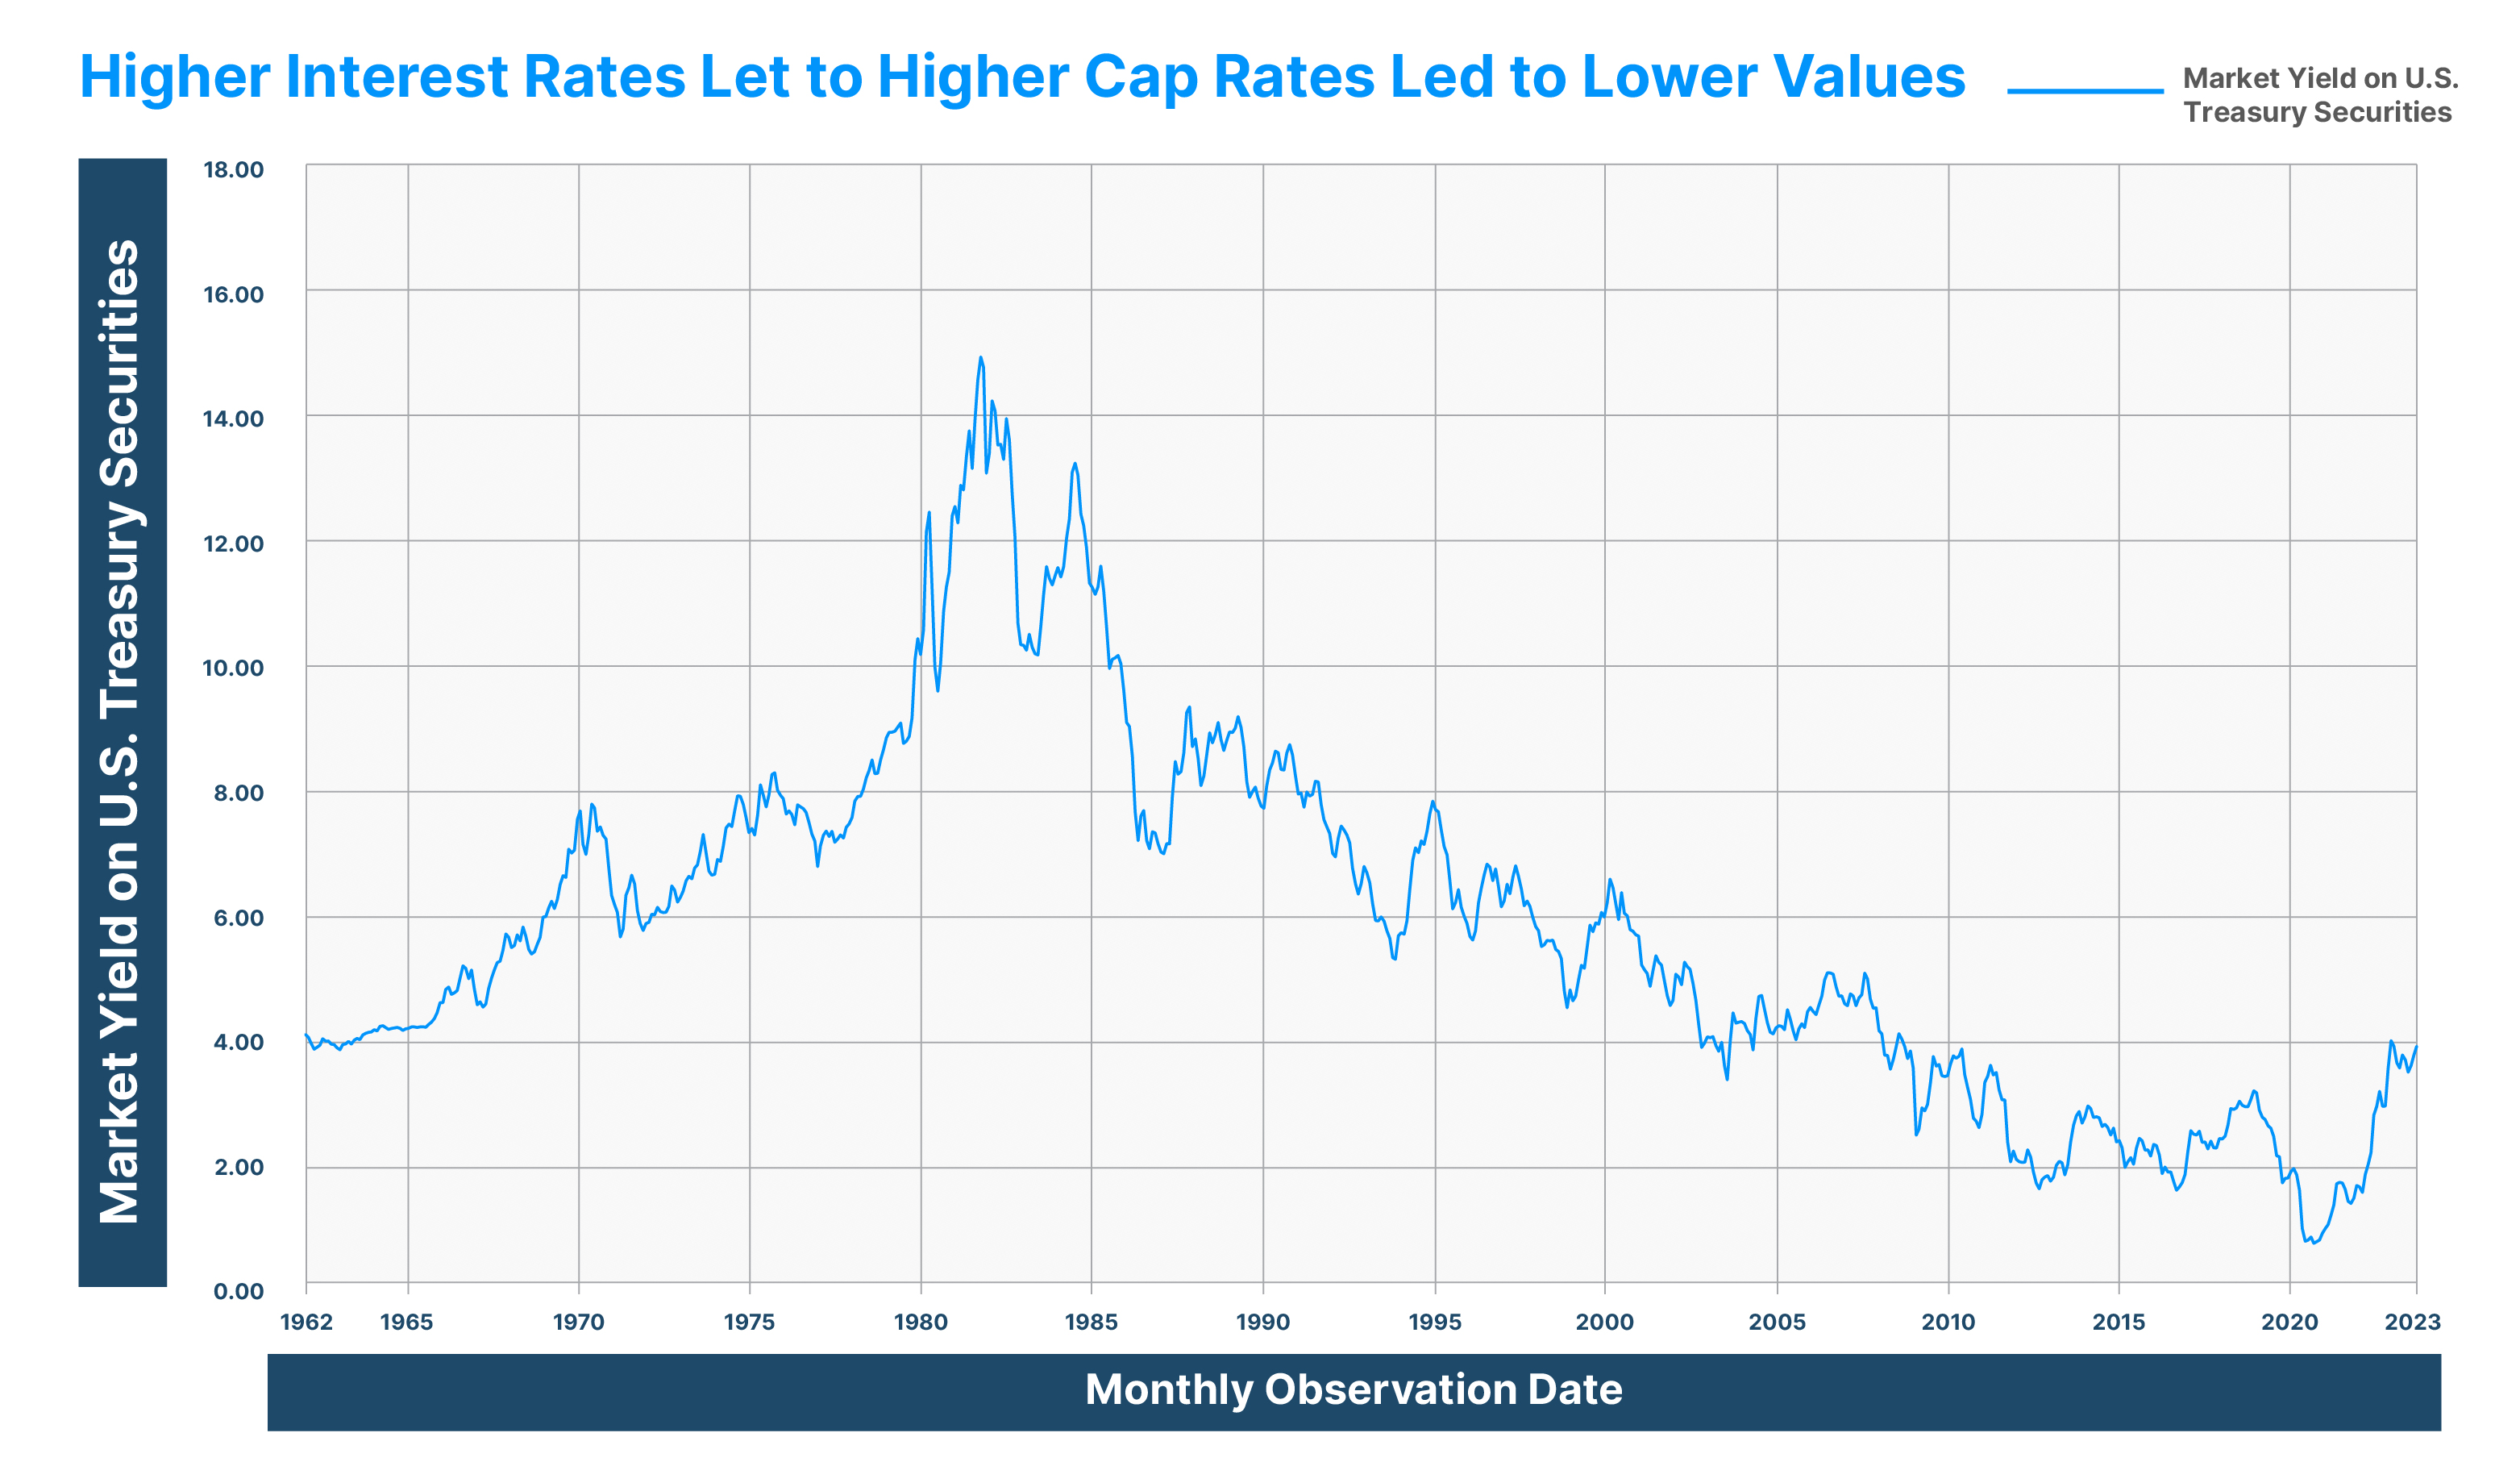
The extended trend for lower interest rates started in 1983 and continued through the beginning of 2022. After the initial shock of COVID, real estate investors resumed active investing. Active investing became frenzied investing as 10-year-treasury rates fell to 60-year lows in mid-2020 through the end of 2021. 10-year-treasury rates fell from 1.75% in late 2019 to 0.75% in mid-2020. 10-year-treasury rates remained below 1.5% through the end of 2021.
Harris County apartment values had been steadily increasing since 2010. Some buyers began to believe that if they bought apartments, they would rise 10 to 20 percent annually, since that is what had been happening for a decade. Such a long-term trend seemed destined to continue. Buyers set an all-time record for Harris County apartment sales in 2021, buoyed up by abundant equity and cheap debt. Apartment sales in Harris County exceeded the 2019 level of sales by 269%. Floating rate debt further supercharged the volume of sales activity and the sales prices.
Buyers were keen not to miss out on a sure thing; apartment prices continuing to climb as they had for a decade. Buyers widely employed floating rate debt with short term (2 to 3 years) interest rate caps. In 2021, interest rates rose a bit, but apartment values were soaring. The perceived risk of using floating rate debt seemed minimal.
Lenders believed the story. Harris County apartment loans originated in 2021 increased 195% over the 2019 level.
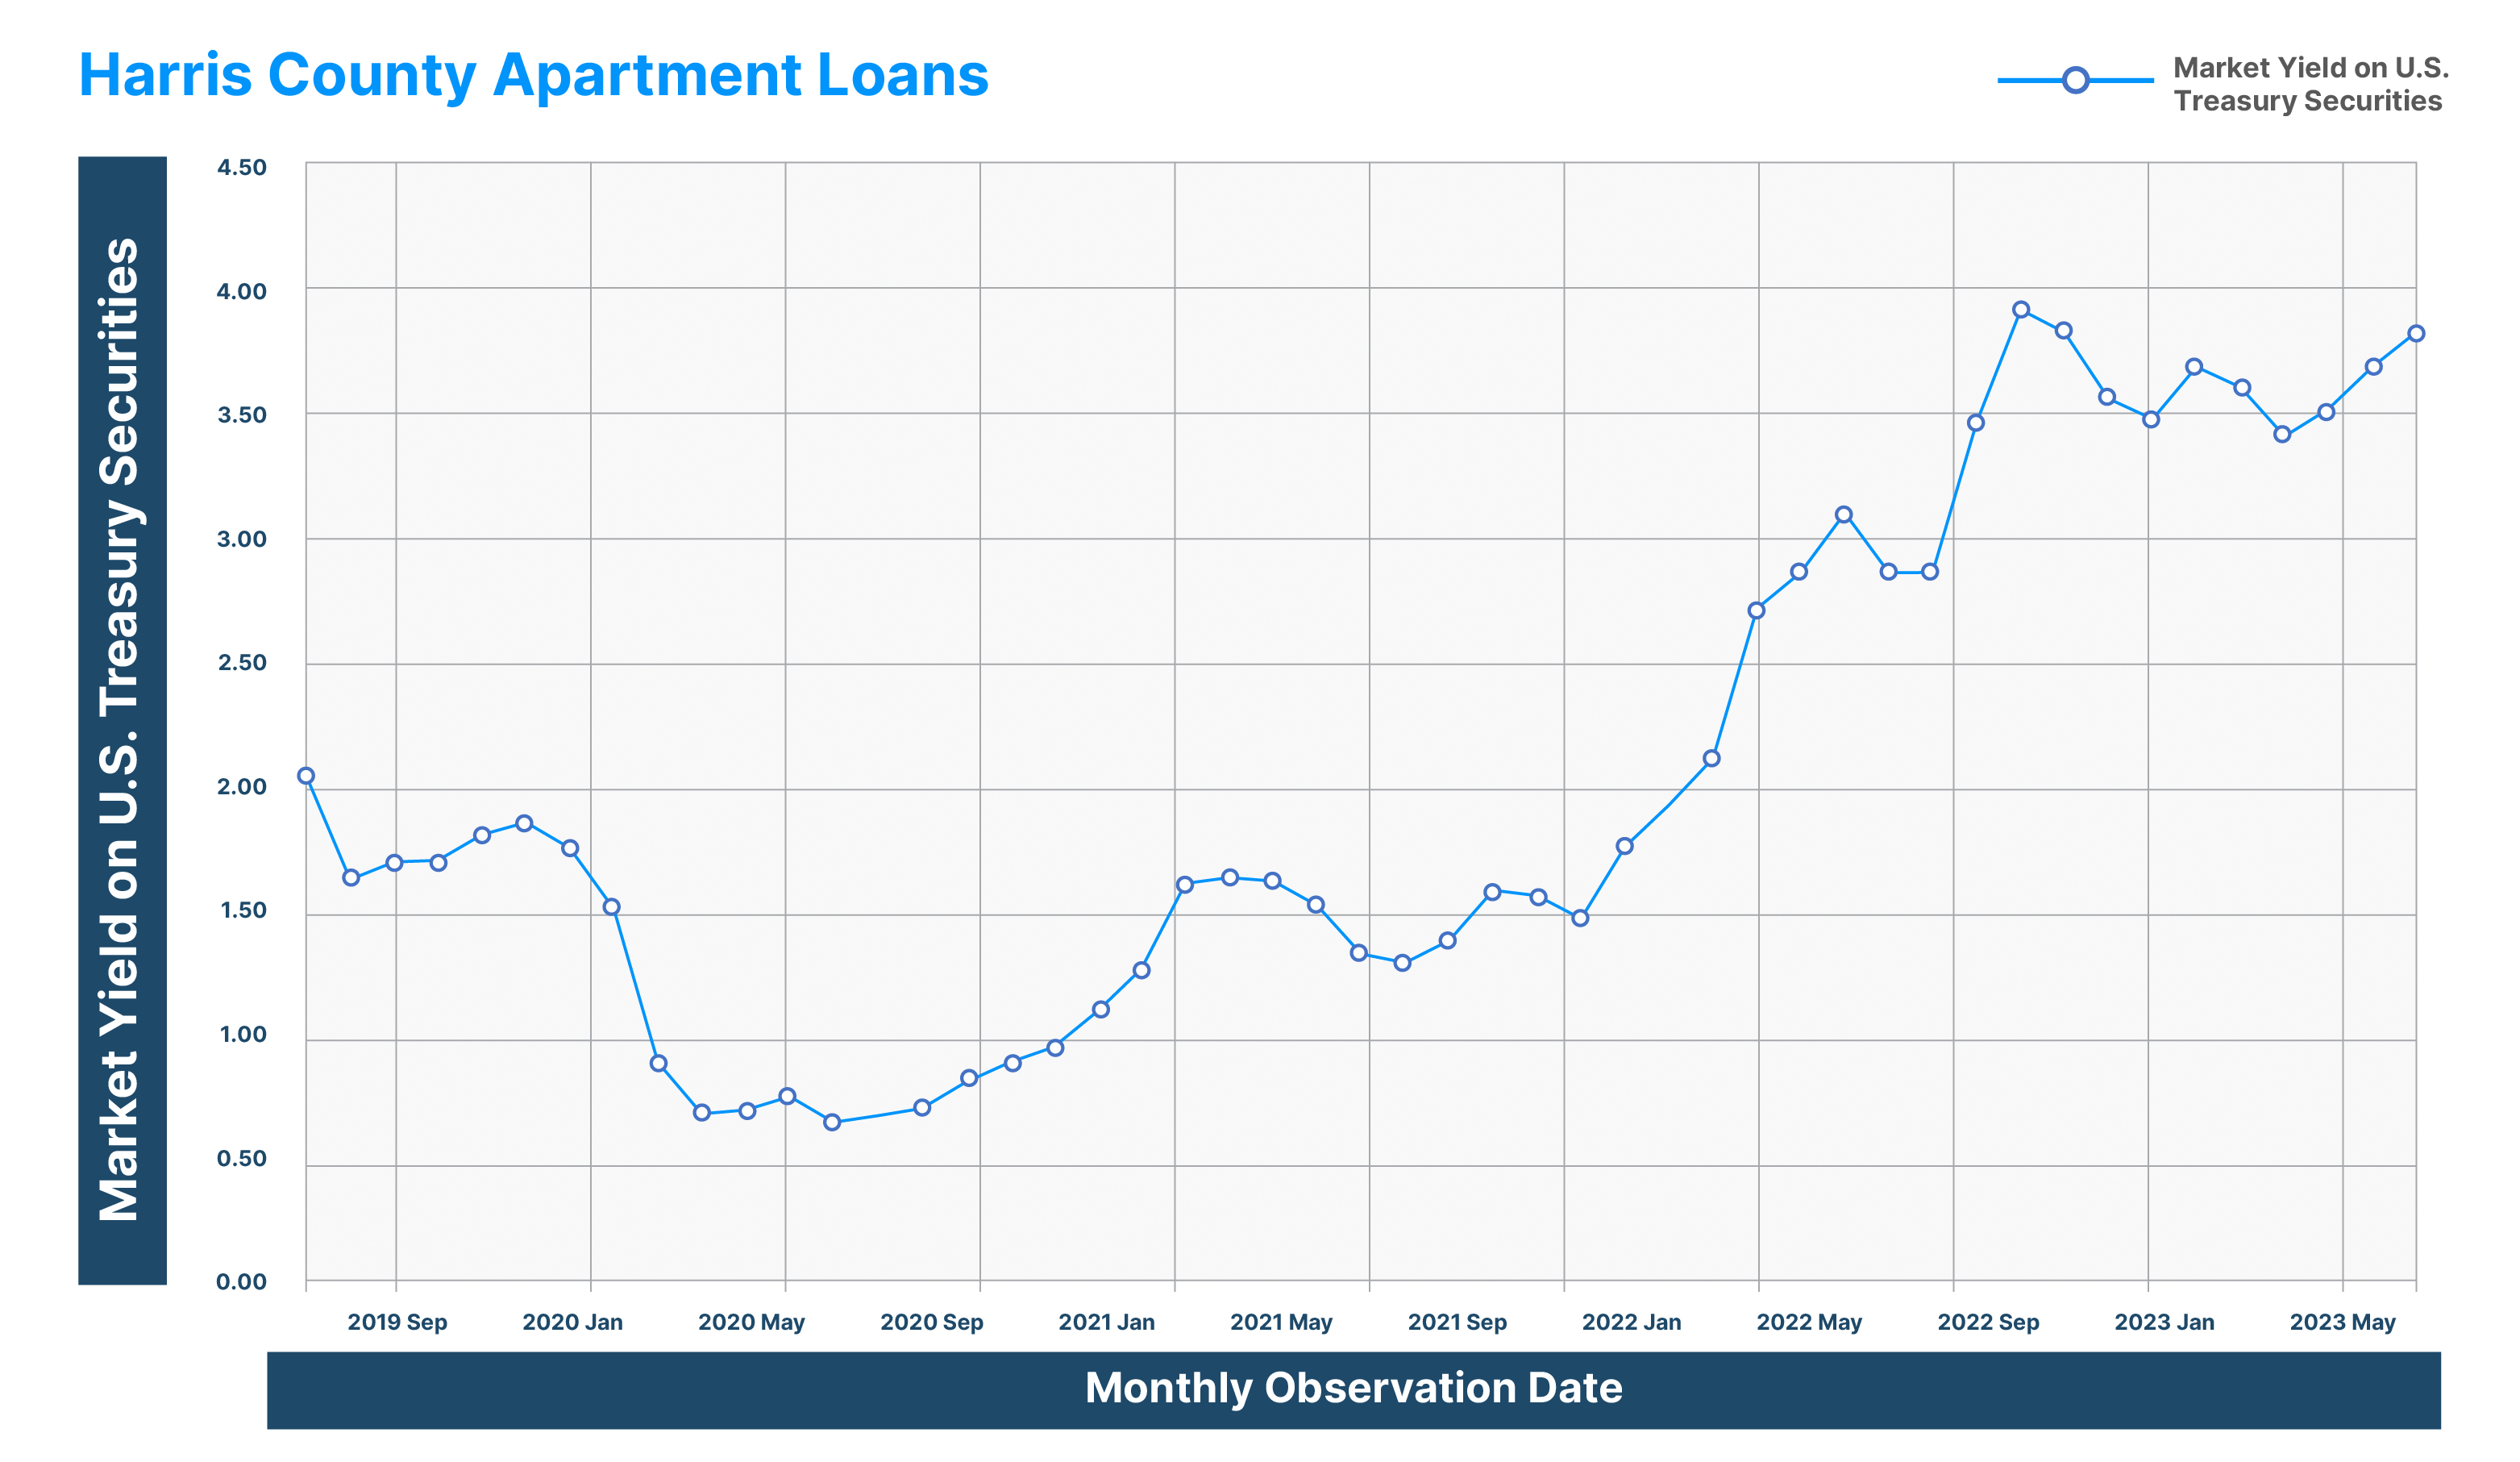
The love story between investors and Harris County apartments was obliterated by an old villain – inflation. Treasury rates are a combination of a safe rate and an inflation premium. The inflation premium was near zero during 2020 in the midst of COVID. However, inflation increased steadily during 2021 but was dismissed as transitory (short-term). By the beginning of 2022, it was clear inflation was a serious problem. Inflation was last considered a serious problem in the 1970s and early 1980s. Most current active apartment buyers had never seen a rapid and steep increase in interest rates. However, due to concerns about inflation, interest rates rose from ~1.5% to between 3.5 and 4.0% following the end of 2021 to mid-2023.
Cap Rates have Soared
Buyers need to be able to offer investors either a meaningful cash-on-cash return or exceptional upside. The cash-on-cash return is a function of positive financial leverage. Positive financial leverage occurs when the capitalization rate (cap rate) exceeds the interest rate (cost of money). The ten-year-treasury rate rose from 1.5% in late 2021 to 3.55% in early January 2023, a 2.05% increase. Cap rates are tied to 10-year-treasury rates.
Cap rates include the cost of money plus an additional factor for operating risk, illiquidity and uncertainty. As an example, a property with a cap rate of 4% in January 2022 would have likely risen to 6.05% in January 2023. Assuming a property with $100,000 of net income, the value would have fallen from $2.5 million to $1.65 million based solely on the increase in cap rates. The spurt in cap rates has caused a canyon of difference between the values acceptable to buyers and what sellers will accept.
Many buyers had been purchasing apartments with 3% floating rate debts based on a 4 to 5% cap rate. This was substantial positive leverage. Floating rate loans are now often at 6 to 8% depending on the level of leverage. If the floating rate debt is 7.0%, the cap rate has to exceed 7.0% for positive financial leverage to exist.
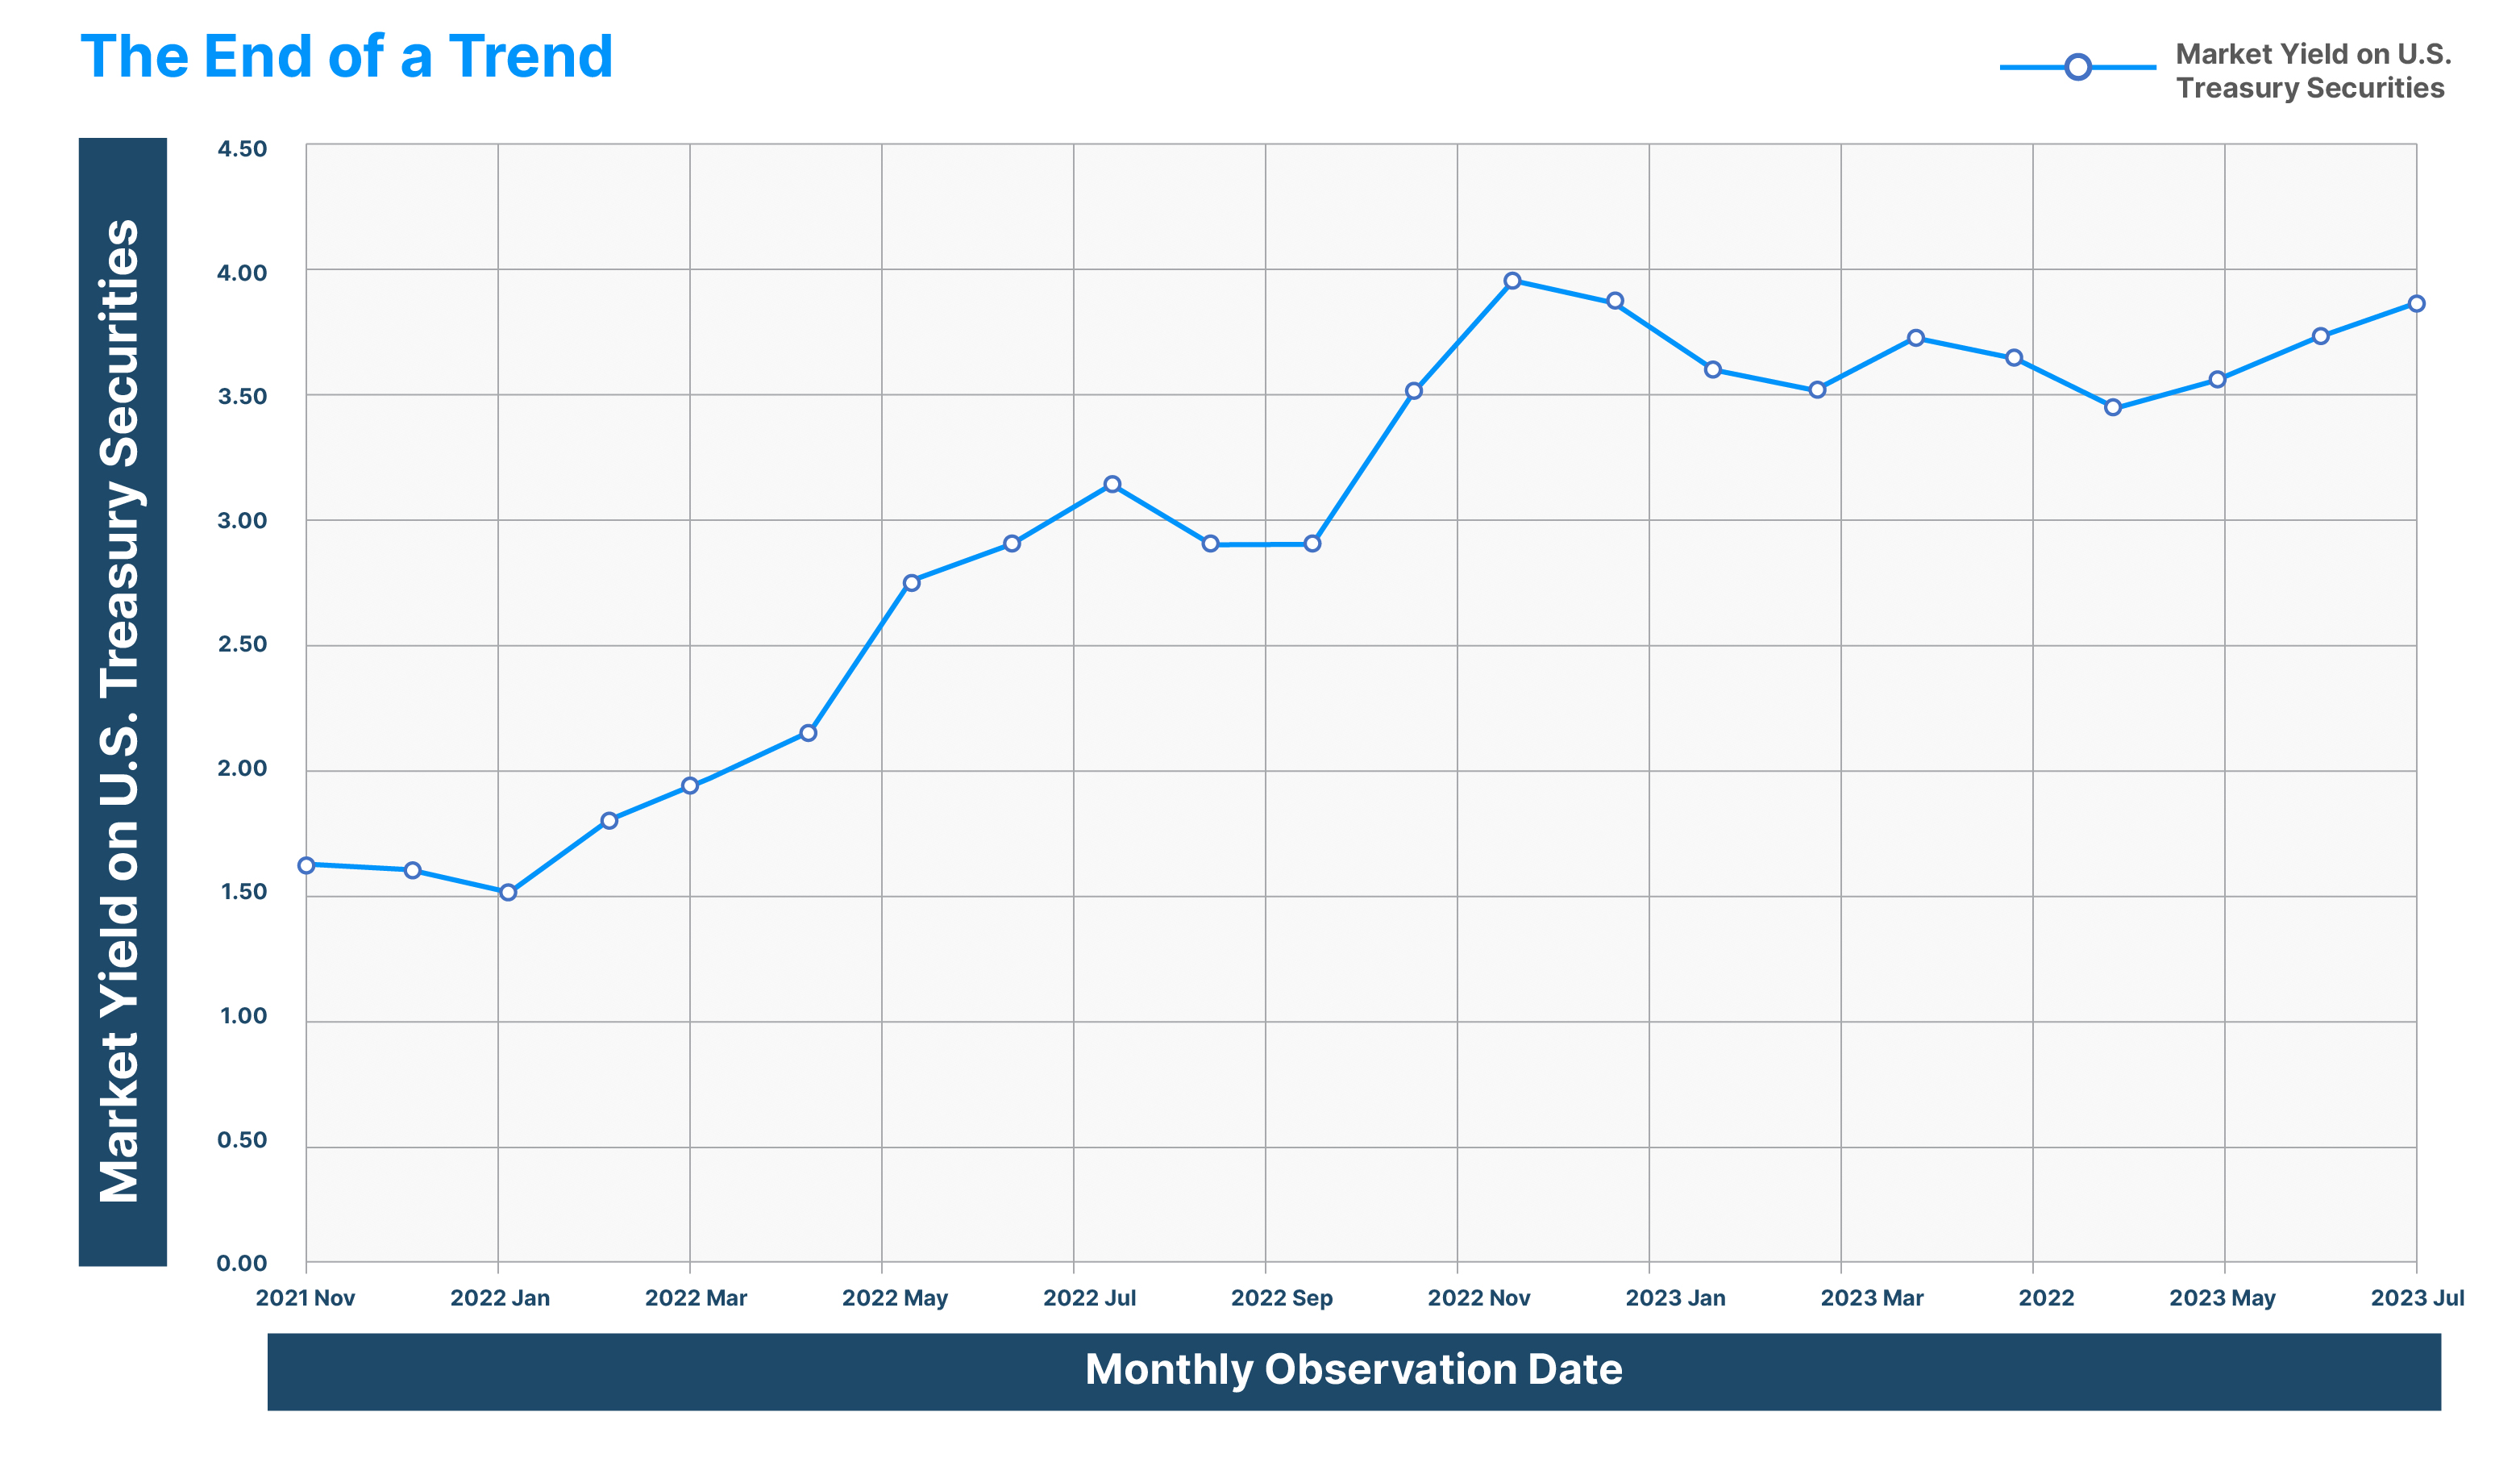
The US Federal Reserve just increased rates 0.25% as I write this on July 26, 2023, while also indicating another 0.25% rate hike may be needed. While inflation has abated, a red-hot US labor market and stronger than expected economic growth are inhibiting reducing the rate of inflation to the 2% target level. Rates are higher than expected 12 months ago and higher than expected 6 months ago.
Operating Costs Have Soared
Casualty insurance, property taxes and labor are all more expensive. Casualty insurance is especially a problem for apartments and especially in the southern US. Casualty insurance has risen, often by 100 to 200%, in markets from Texas to Florida. Coverage along the Gulf Coast is limited. Insurance companies are fleeing California for a variety of factors.
As apartment values soared during 2010 to 2021, tax assessors have been aggressively increasing property tax assessments. It is the increase in interest rates, beginning in January 2022, that reversed the trend in apartment values.
Operating expenses including labor and a variety of other factors have also increased. Yes, apartment owners saw sizable rent increases in 2019 to 2021, but the rental market has now flattened. Worse yet, it appears that new construction will exceed absorption, leading to a higher vacancy rate, meaning more unoccupied units. Buyers set value based on future expectations. Current expectations are for flat to small increases in rents, with declines in some areas.
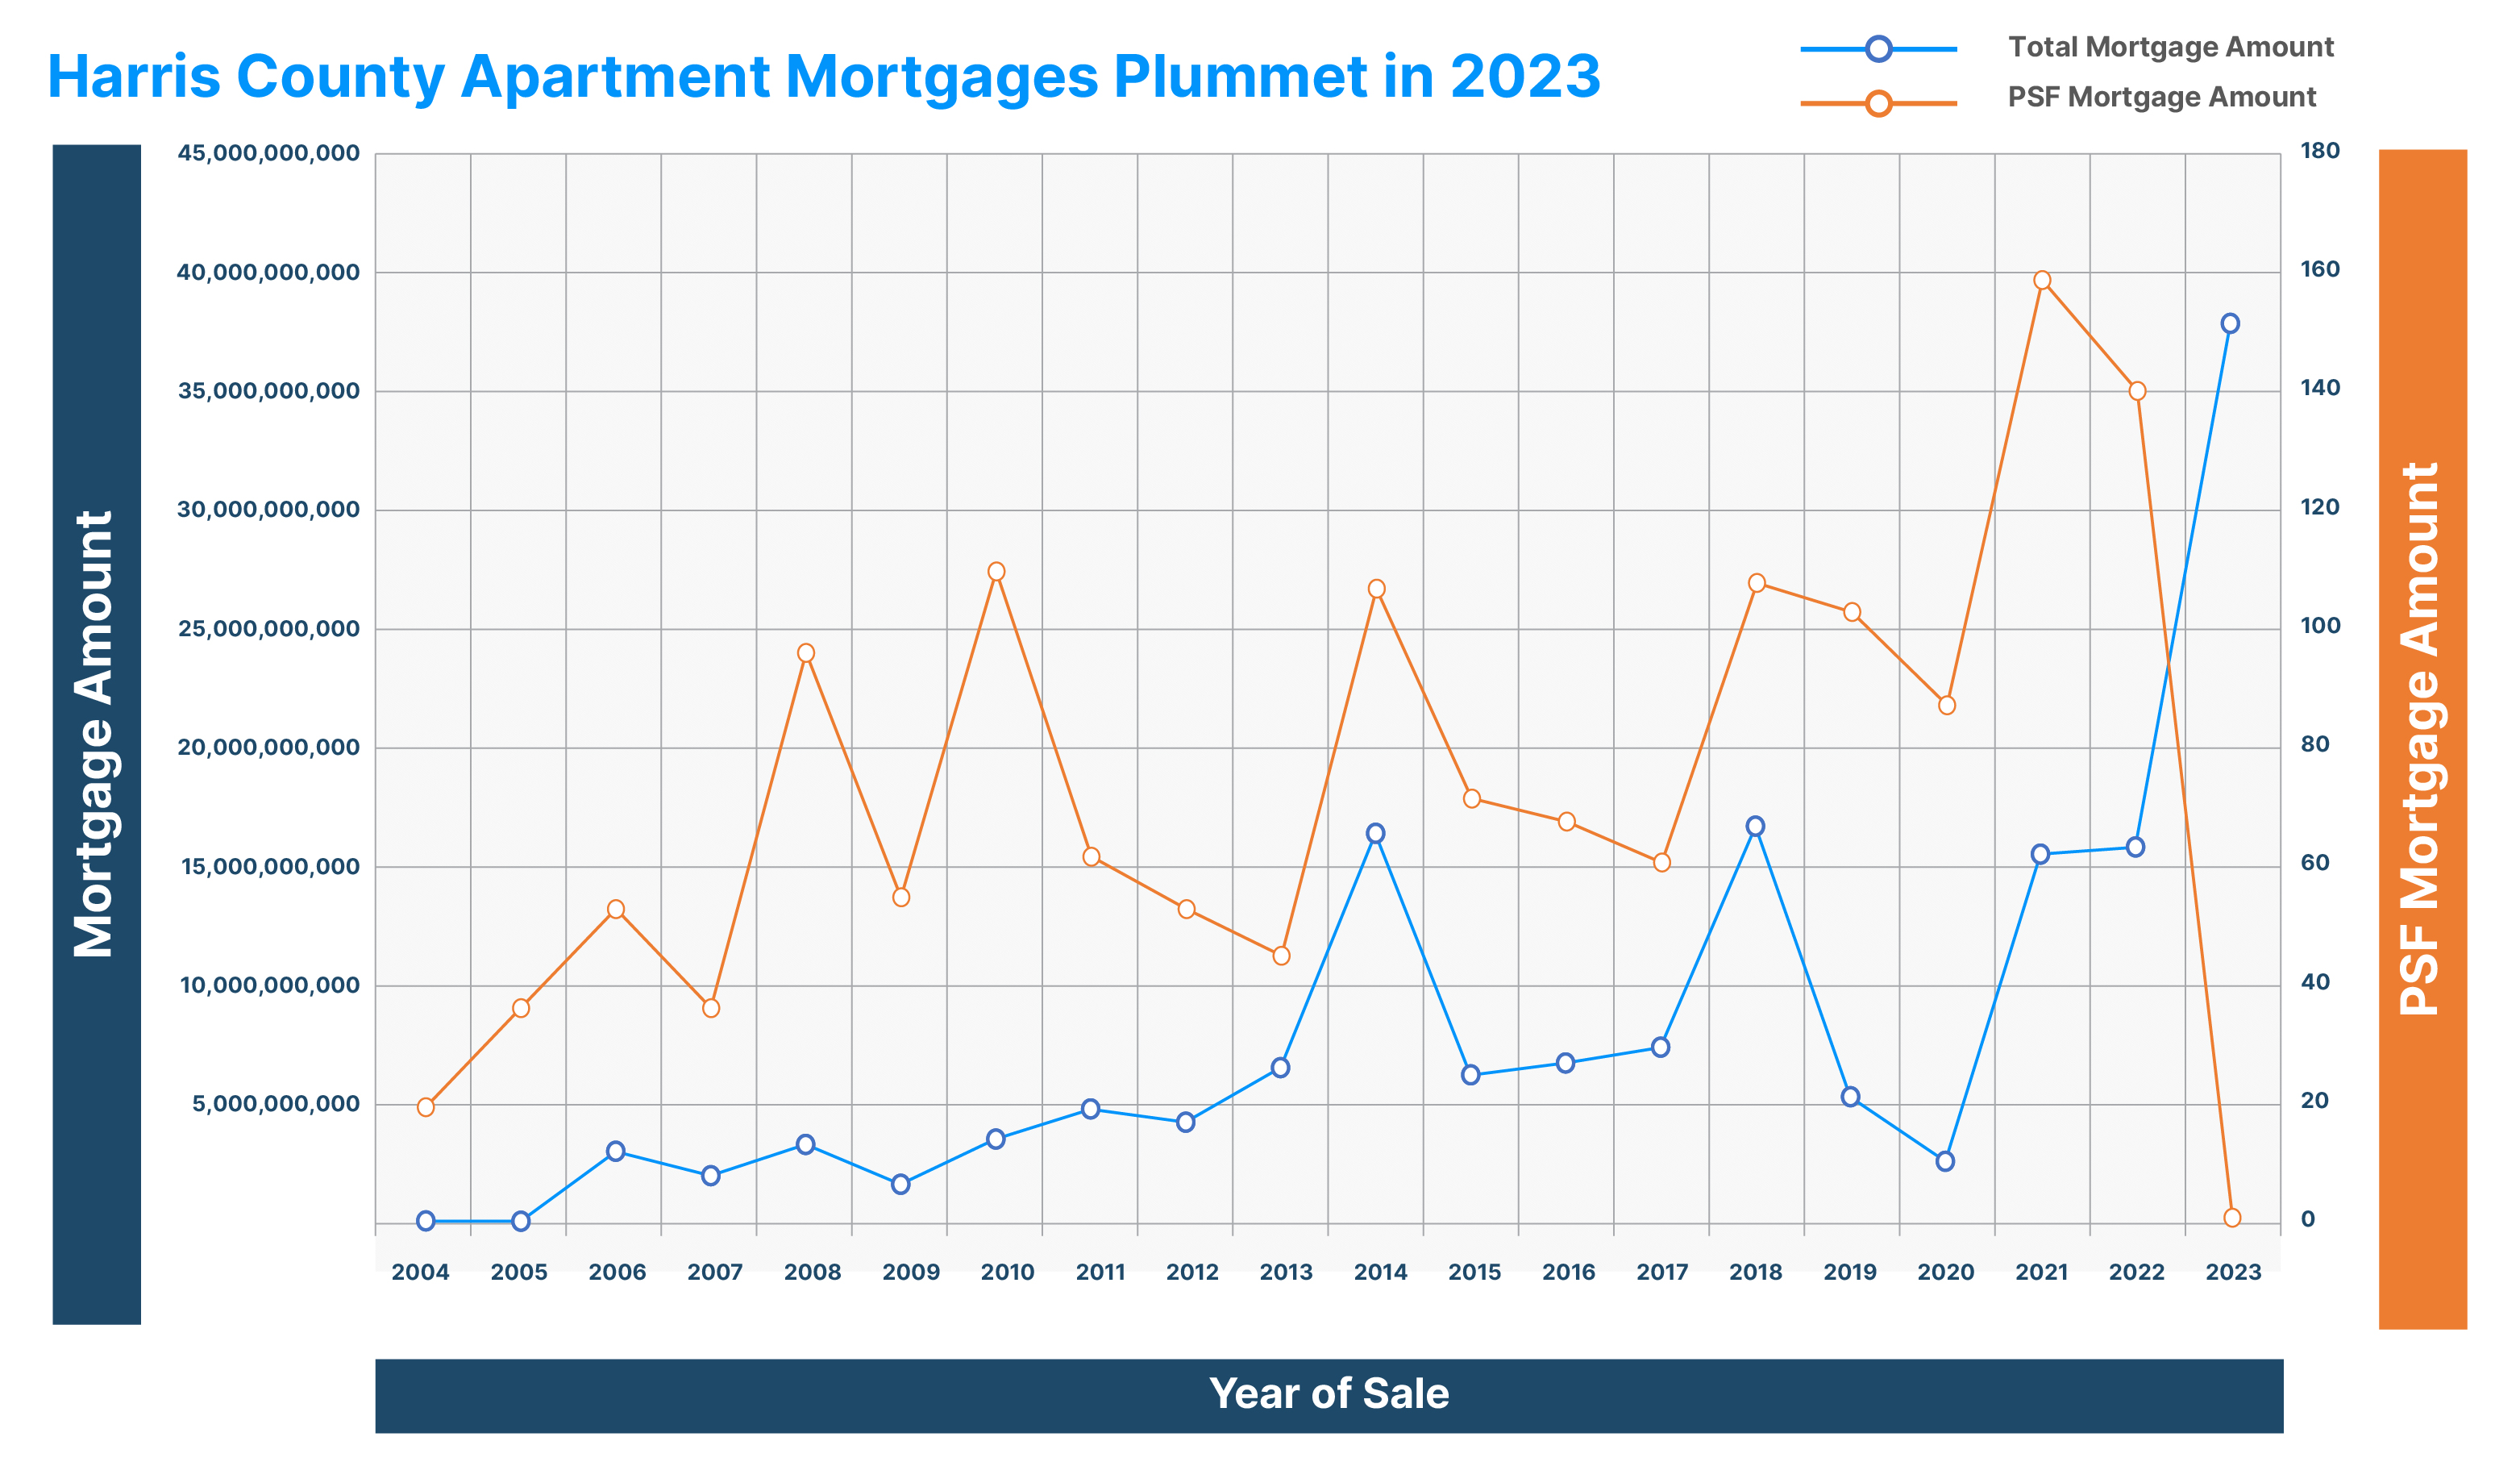
Harris County Apartment Mortgages Plummet in 2023
Loans for Harris County apartments have plunged due to higher interest rates, lower net income and tighter lending standards. Most lenders are in the market for apartment loans but are more selective regarding borrowers and more conservative with loan-to-value and debt-coverage-ratio metrics.
Harris County apartment loans totaled $15.8 billion in 2021, $16.1 billion in 2022 and are on pace to total just $3.7 billion in 2023.
Factors driving lower mortgage activity are:
- Lower Harris County apartment sales.
- More rigorous underwriting.
- Higher interest rates reduce the loan balance possible.
- Many borrowers are reluctant to borrow long-term since 10-year-treasuries are high compared to the level of the past 5 years and they hope rates will decline
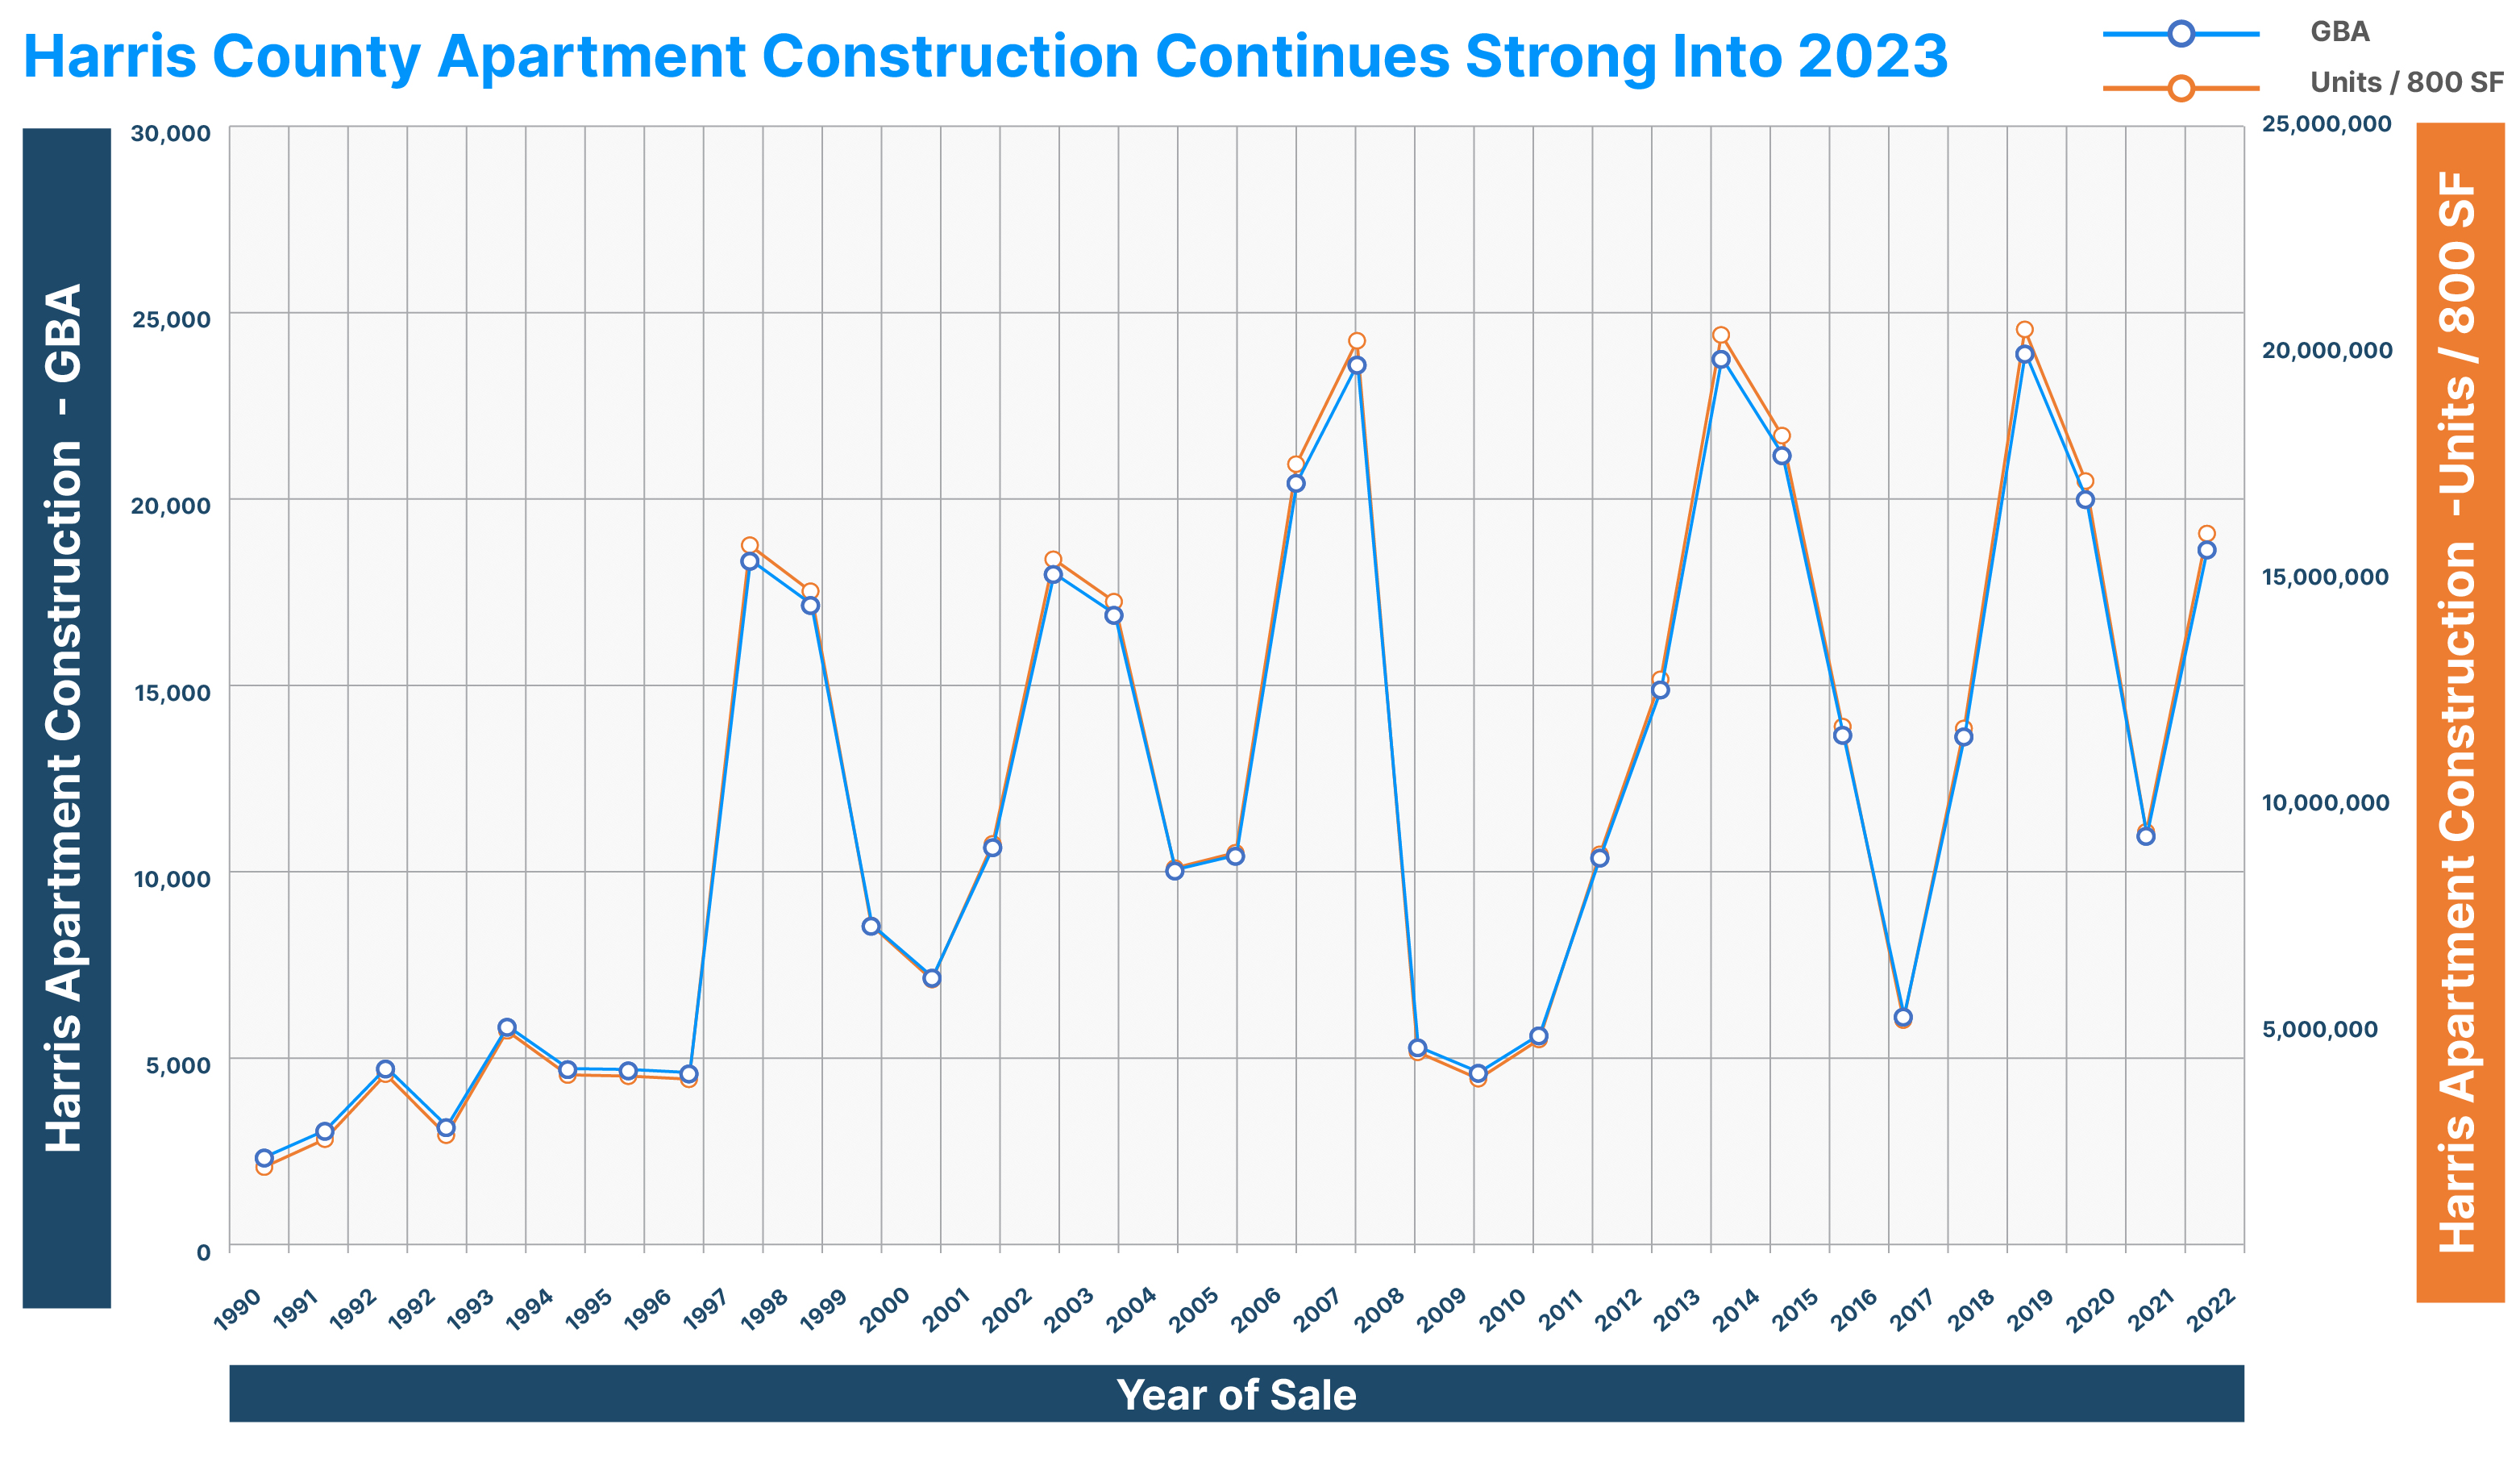
Harris County Apartment Construction Continues Strong Into 2023
The volume of apartment construction exceeds absorption of units in Houston and most other Texas markets. This is believed to be a national trend. If apartment construction completions substantially exceed apartment absorption, it will have a negative impact on apartment rental and occupancy rates.
Harris County apartment construction totaled 20,881 units in 2020, 11,422 in 2021 and 19,470 in 2022 with another ~20,000 units expected in 2023. Absorption has generally kept pace with construction. Harris County apartment occupancy has ranged between 90 and 92% during the last four years.
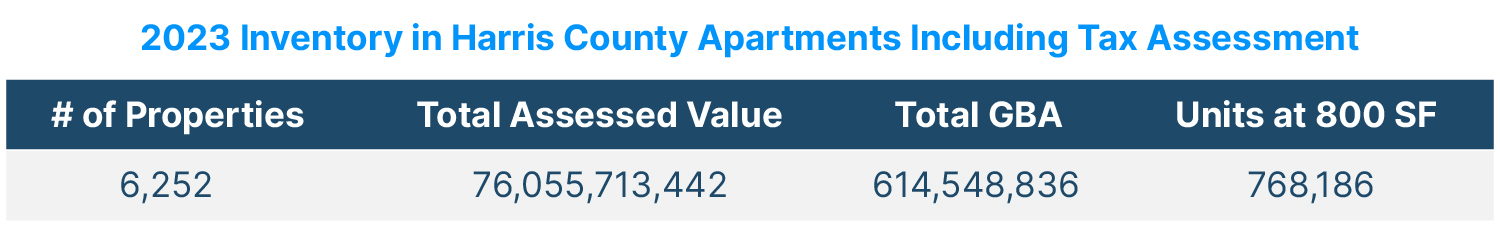
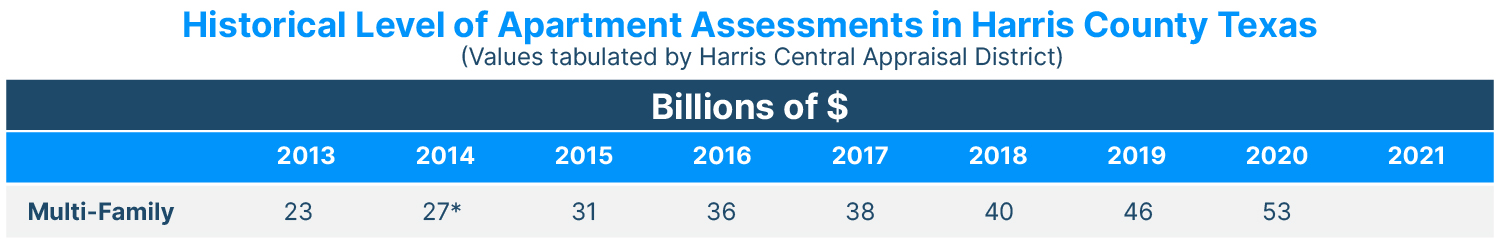
The total volume of apartments in Harris County exceeds the volume in most states. The assessed value of Harris County apartments has increased 230% since 2013. Increases in property tax assessments for Harris County apartments have far exceeded the pace of increasing values. Only 5 other counties have apartments with tax assessments that exceed $50 billion: 1) Los Angeles CA $157 billion, 2) Wake NC $114 billion, 3) Dallas TX $68 billion, 4) Travis TX $56 billion and Santa Clara CA $50 billion.
The pace of property tax assessments exceeds the pace of appreciation in Harris County apartments. Apartment owners are actively appealing annual reassessments of property taxes on Harris County Apartment Assessed Values.
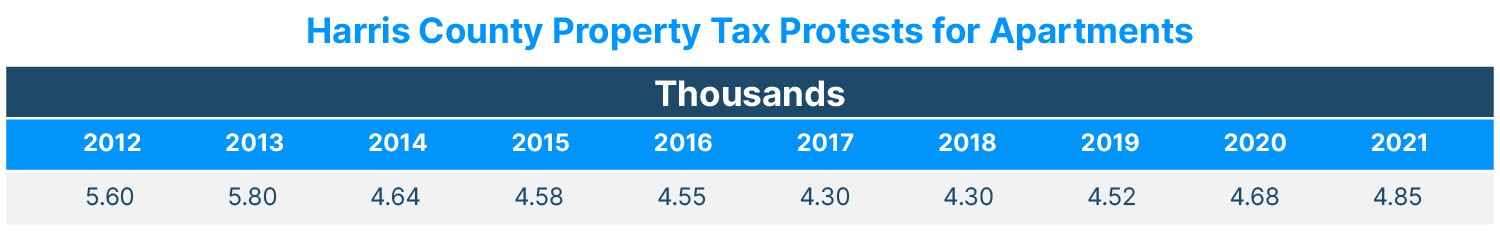
Most Harris County apartment owners file a property tax protest in most years. It is likely over 90% of protests reduce Harris County apartment property taxes between the informal, appraisal review board and lawsuit appeals on Property tax protests filed for Harris County Apartments by Number.
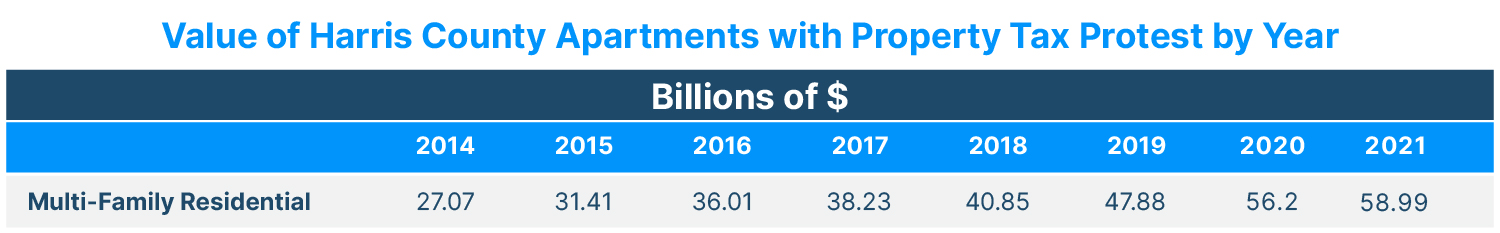
There are three levels of property tax appeal in Texas: 1) informal, 2) appraisal review board and 3) lawsuit in district court. The first two levels are collectively referred to as administrative appeals. Harris Central Appraisal District reports a total value of $55 billion in apartments for 2021 and administrative protests for $58.99 billion. A reasonable interpretation is that virtually all apartment owners in Harris County protest every year at the administrative level on Property tax protests filed for Harris County Apartments in $
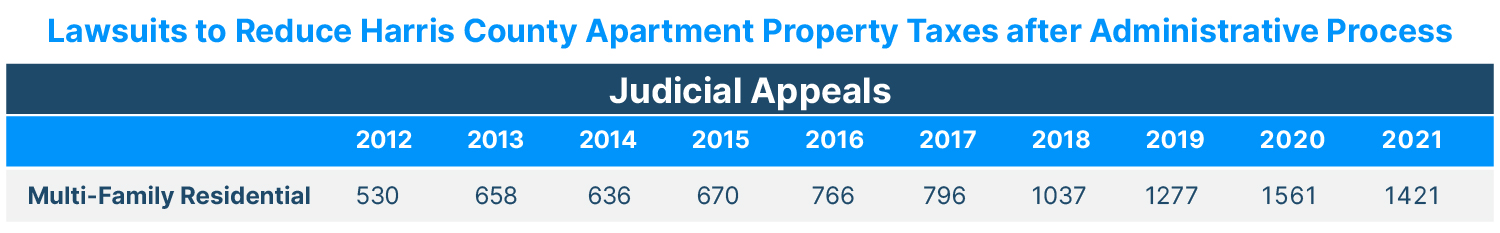
Harris County apartment owners have clearly reacted to the massive increase in apartment tax assessments. Total Harris County apartment tax assessments were $23 billion in 2013 and rose to $76 billion in 2023, a 230% increase over ten years. The portion of apartments protested at both the administrative level and the lawsuit level has increased three-fold. In 2013, about 10% of owners who filed an administrative appeal for Harris County apartments also filed a lawsuit to reduce the property taxes. By 2021, 30% of owners filing an administrative appeal were also filing a judicial appeal on Harris County Apartment Property Tax Lawsuits by Number.
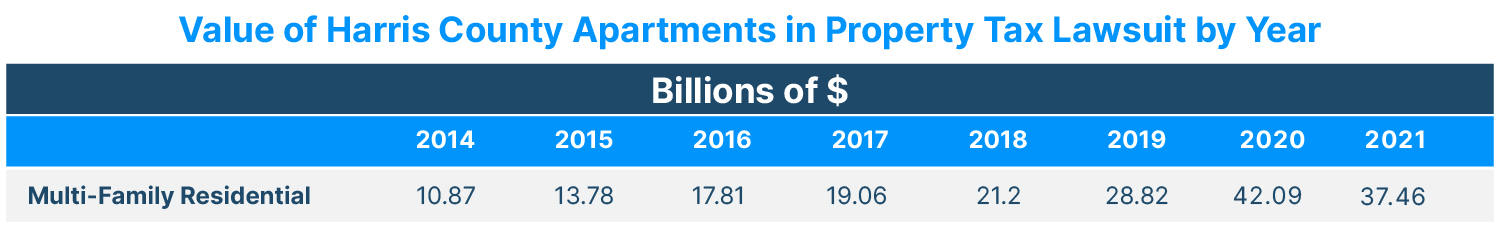
The value of Harris County apartment tax assessments disputed with a district court lawsuit has increased from about $10.87 billion in 2014 to $37.46 billion in 2021, almost a 300% increase. Harris County apartment owners have been very effective at reducing property taxes using the judicial appeal / district court remedy on Harris County Apartment Property Tax Lawsuits by Dollar.
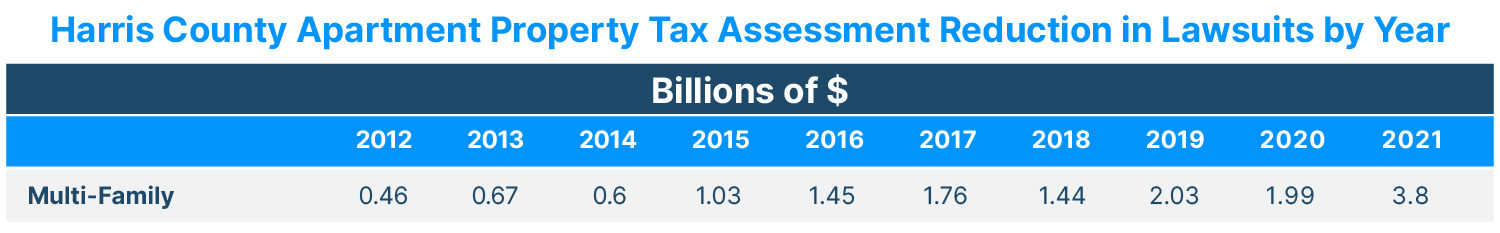
Harris County apartment owners have steadily become more effective at achieving substantial reductions in property taxes through lawsuit protests. The amount of Harris County apartment tax assessment reduction has risen from $0.46 billion in 2012 to $3.8 billion in 2021, an 820% increase in 9 years. Part of the reason for the larger reductions from lawsuits is the aggressive pace of Harris County apartment assessment increases on Harris County Apartment Property Tax Lawsuits Assessment Reduction

Harris County apartment owners have reduced their property taxes substantially via lawsuit protests. The property tax savings increased from $12.4 million in 2012 to $102.6 million in 2021, an 827% increase in 9 years. Owners who pursue a protest at the lawsuit stage account for about 30% of apartment owners and they do so for a simple reason; it works. The increase in property tax savings for Harris County apartment owners is clear and substantial on Harris County Apartment Property Tax Lawsuits Tax Savings.
Next Steps?
Property taxes
Apartment owner can check to see if they are over-valued using the Property Tax Fairness Checker
US Real Estate Data for Commercial and Residential – over 150 million properties
To obtain data for apartments for any county in the United States
In depth data is available for over 150 US properties, including over 30 million commercial properties. Basic data is available for each property along with property ownership history, comparable sales (over 200 million comparable sales), mortgages (over 216 million mortgages), tenants for commercial, assessment history, Property Tax Fairness Checker, ownership research, active lenders for each property type in each area, and a flood map link.
Subscribers can also utilize a broker price opinion report generator.
Harris County Apartment Sales by Year 1994 to 2023
| Year | # of Sales | Total Assessed Value | GBA |
|---|---|---|---|
| 2023 | 564 | 7,710,350,742 | 50,040,777 |
| 2022 | 982 | 17,468,333,410 | 137,673,480 |
| 2021 | 1,228 | 33,352,590,743 | 255,229,955 |
| 2020 | 570 | 10,859,155,755 | 78,175,340 |
| 2019 | 486 | 9,044,418,555 | 63,739,225 |
| 2018 | 822 | 18,434,629,187 | 127,447,391 |
| 2017 | 725 | 11,527,260,162 | 87,042,893 |
| 2016 | 708 | 10,507,209,533 | 84,513,775 |
| 2015 | 797 | 13,582,311,472 | 98,033,232 |
| 2014 | 759 | 14,257,643,532 | 104,416,363 |
| 2013 | 721 | 11,631,815,513 | 87,147,760 |
| 2012 | 639 | 10,125,426,884 | 78,824,141 |
| 2011 | 645 | 10,404,657,615 | 87,851,035 |
| 2010 | 732 | 10,586,169,346 | 88,502,997 |
| 2009 | 540 | 4,949,528,799 | 44,446,973 |
| 2008 | 717 | 8,950,169,674 | 78,537,502 |
| 2007 | 860 | 12,511,938,534 | 104,892,863 |
| 2006 | 972 | 11,059,413,380 | 91,118,326 |
| 2005 | 577 | 6,699,334,064 | 57,788,760 |
| 2004 | 446 | 4,067,297,557 | 36,956,367 |
| 2003 | 419 | 5,147,335,380 | 49,977,310 |
| 2002 | 358 | 4,194,703,884 | 41,815,745 |
| 2001 | 258 | 3,061,435,028 | 26,863,539 |
| 2000 | 358 | 4,350,125,410 | 40,591,625 |
| 1999 | 372 | 3,689,728,010 | 36,244,322 |
| 1998 | 477 | 6,602,554,614 | 59,478,010 |
| 1997 | 428 | 6,299,670,282 | 59,454,394 |
| 1996 | 282 | 3,362,615,278 | 32,190,892 |
| 1995 | 241 | 2,346,525,020 | 23,219,914 |
| 1994 | 248 | 2,947,792,509 | 31,258,449 |
Harris County Apartment Mortgage Volume by Year
| Year | Total Assessed Value | Total Mortgage Amount | # of Mortgages | GBA |
|---|---|---|---|---|
| 2023 | 5,885,217,509 | 3,699,392,299 | 480 | 51,381,698 |
| 2022 | 13,611,268,301 | 16,062,125,348 | 999 | 112,401,041 |
| 2021 | 13,570,758,071 | 15,760,085,718 | 718 | 97,613,420 |
| 2020 | 3,665,254,006 | 2,574,795,588 | 330 | 29,071,092 |
| 2019 | 6,817,692,283 | 5,342,666,312 | 407 | 51,364,775 |
| 2018 | 21,035,791,886 | 16,956,744,138 | 982 | 154,164,687 |
| 2017 | 14,869,558,031 | 7,469,863,576 | 867 | 122,431,113 |
| 2016 | 10,903,874,402 | 6,795,452,092 | 712 | 98,917,808 |
| 2015 | 9,828,566,944 | 6,282,364,453 | 685 | 87,204,406 |
| 2014 | 18,415,668,975 | 16,651,364,057 | 959 | 153,859,250 |
| 2013 | 16,282,108,468 | 6,594,964,831 | 1,024 | 143,671,036 |
| 2012 | 8,978,211,156 | 4,252,526,219 | 541 | 79,352,897 |
| 2011 | 9,423,772,664 | 4,818,880,994 | 532 | 77,376,881 |
| 2010 | 3,565,285,311 | 3,531,887,314 | 266 | 31,735,661 |
| 2009 | 3,057,639,796 | 1,588,397,556 | 285 | 28,779,530 |
| 2008 | 3,695,706,877 | 3,299,782,758 | 410 | 33,732,524 |
| 2007 | 5,857,356,280 | 1,958,544,575 | 597 | 53,698,978 |
| 2006 | 6,079,175,457 | 3,002,709,886 | 767 | 55,629,363 |
Harris County Apartment Construction by Year – 1990 to 2023
| Year Built | # of Properties | Current Assessed Value | Sum of GBA | Units @ 800 SF |
|---|---|---|---|---|
| 2022 | 70 | 1,369,520,668 | 15,575,885 | 19,470 |
| 2021 | 62 | 1,316,095,521 | 9,137,468 | 11,422 |
| 2020 | 71 | 3,578,314,490 | 16,704,819 | 20,881 |
| 2019 | 83 | 3,996,877,890 | 19,976,377 | 24,970 |
| 2018 | 46 | 2,429,191,688 | 11,371,404 | 14,214 |
| 2017 | 41 | 954,875,513 | 5,077,114 | 6,346 |
| 2016 | 58 | 2,139,315,379 | 11,408,693 | 14,261 |
| 2015 | 78 | 3,410,130,217 | 17,689,458 | 22,112 |
| 2014 | 84 | 3,868,132,328 | 19,859,425 | 24,824 |
| 2013 | 59 | 2,225,688,130 | 12,431,870 | 15,540 |
| 2012 | 45 | 1,437,129,554 | 8,651,904 | 10,815 |
| 2011 | 27 | 706,452,126 | 4,657,458 | 5,822 |
| 2010 | 29 | 324,764,129 | 3,811,052 | 4,764 |
| 2009 | 23 | 596,850,051 | 4,383,252 | 5,479 |
| 2008 | 80 | 2,767,557,484 | 19,730,591 | 24,663 |
| 2007 | 63 | 2,308,136,070 | 17,068,893 | 21,336 |
| 2006 | 40 | 1,046,580,500 | 8,688,514 | 10,861 |
| 2005 | 43 | 815,467,558 | 8,359,543 | 10,449 |
| 2004 | 62 | 1,309,270,968 | 14,106,985 | 17,634 |
| 2003 | 56 | 1,600,511,471 | 15,020,672 | 18,776 |
| 2002 | 40 | 827,676,137 | 8,881,624 | 11,102 |
| 2001 | 34 | 596,847,908 | 5,949,557 | 7,437 |
| 2000 | 34 | 844,361,531 | 7,118,526 | 8,898 |
| 1999 | 56 | 1,747,692,764 | 14,329,033 | 17,911 |
| 1998 | 58 | 2,036,016,430 | 15,322,344 | 19,153 |
| 1997 | 22 | 316,227,024 | 3,801,800 | 4,752 |
| 1996 | 24 | 498,704,562 | 3,869,157 | 4,836 |
| 1995 | 18 | 517,804,476 | 3,894,629 | 4,868 |
| 1994 | 19 | 727,695,113 | 4,845,670 | 6,057 |
| 1993 | 9 | 336,292,975 | 2,593,919 | 3,242 |
| 1992 | 16 | 596,410,752 | 3,911,982 | 4,890 |
| 1991 | 10 | 368,710,725 | 2,507,352 | 3,134 |
| 1990 | 8 | 289,923,348 | 1,906,739 | 2,383 |